Let’s talk about the truth no one in the DTC space says out loud.
Your supplier relationship is probably built on vibes.
They answer emails quickly. The last shipment was okay. The rep seems nice. So you keep reordering, keep renewing, keep trusting.
Then something breaks.
Late shipment tanks your launch. Quality issues trigger returns. Price creep eats your margin while you weren’t looking.
And suddenly you’re asking: “How did I miss this?”
Here’s the answer: You weren’t tracking the right things.
I once worked with a brand doing $3M a year. They’d been with the same supplier for two years. When I asked how they were performing, the founder said: “Pretty good, I think? We haven’t had any major disasters.”
We pulled the data. Here’s what we found:
- On-time delivery rate: 62% (they thought it was 90%+)
- Quality defect rate: 8.3% (industry standard is under 2%)
- Price increases over two years: 23% (they hadn’t negotiated once)
Pretty good? They were bleeding money and didn’t know it.
Feelings aren’t data. And in DTC, where margins are tight and cash is king, you can’t afford to manage suppliers by gut feeling.
In this article:
- Supplier Power Month: Week 4
- The 5 Metrics That Actually Matter
- The Finance Connection: True Cost vs. Unit Price
- Conversation Scripts: Every Scenario Covered
- The Red/Yellow/Green Framework
- Your Scorecard Template
- Complete Supplier Power Month System
- Action Items: Do This by End of Week
Welcome to Supplier Power Month: Week 4
If you’ve been following along this month, you’ve already built a foundation:
Week 1: Know Your Power — You identified your leverage points. You’re not as powerless as you thought.
Week 2: Negotiate Like a Pro — You learned the scripts and strategies that get results without damaging relationships.
Week 3: Document Everything — You created systems to protect your agreements and track what was promised.
Now it’s time to close the loop.
Because knowing, negotiating, and documenting only work if you’re tracking whether suppliers actually deliver on their promises.
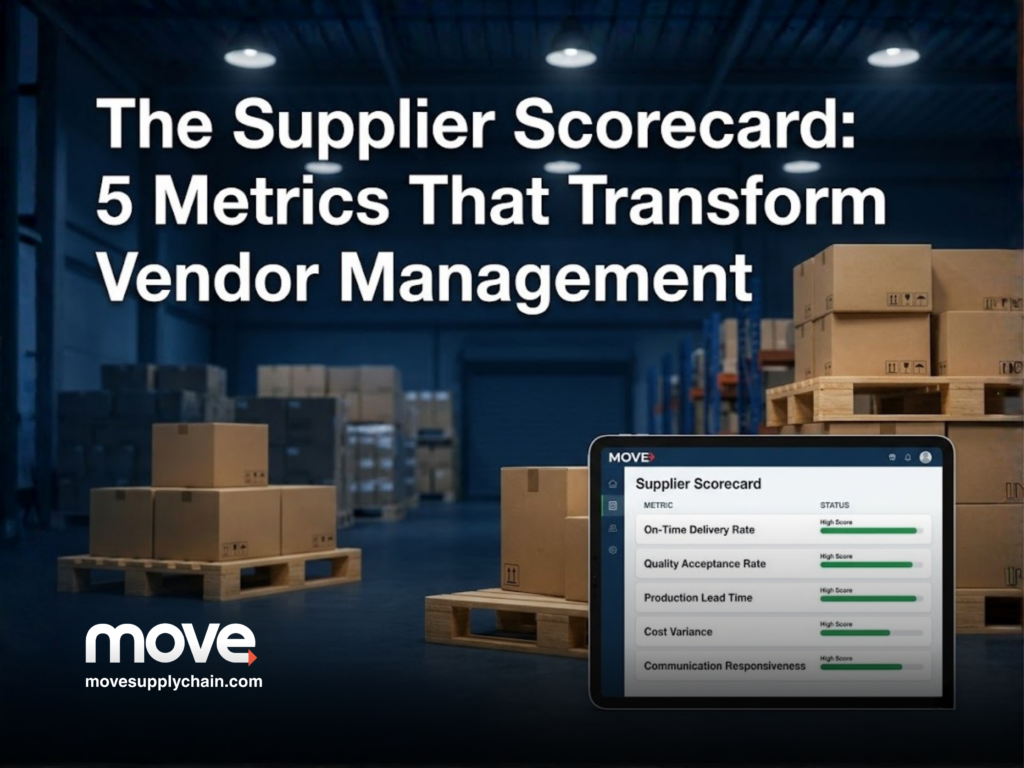
This week, we build your Supplier Scorecard—the system that turns vendor management from reactive firefighting into proactive, data-driven decision-making.
The 5 Metrics That Actually Matter
Forget tracking 47 different KPIs. For DTC brands, there are five metrics that tell you everything you need to know about supplier performance.
Metric 1: On-Time Delivery Rate (OTDR)
What it measures: The percentage of orders delivered on or before the promised date.
The formula:
OTDR = (Orders Delivered On Time ÷ Total Orders) × 100Target: 95%+ for production suppliers, 98%+ for logistics partners
Why it matters: Late deliveries don’t just inconvenience you—they trigger a cascade. Stockouts kill campaigns. Expedited shipping destroys margins. Customer complaints spike.
How to track it: Create a simple spreadsheet. For every PO, log the promised date and actual delivery date. Calculate monthly.
Reality check: Most DTC brands don’t track this at all. When they start, they’re shocked. That supplier who “usually delivers on time”? Often running at 70-80%.
Metric 2: Quality Acceptance Rate (QAR)
What it measures: The percentage of received goods that pass your quality standards.
The formula:
QAR = (Units Accepted ÷ Units Received) × 100Target: 98%+ for most products, 99.5%+ for anything touching skin or consumables
Why it matters: Quality issues are expensive. Returns cost 2-3x the product value when you factor in shipping, labor, customer service, and reputation damage.
How to track it: Implement even basic receiving inspection. Count defects. Log them. A 15-minute check saves thousands.
Red flag: If your supplier can’t tell you their own defect rate, that’s a problem. Quality-focused suppliers know their numbers.
Metric 3: Price Variance (PV)
What it measures: How actual costs compare to quoted or contracted prices over time.
The formula:
PV = ((Actual Price - Quoted Price) ÷ Quoted Price) × 100Target: 0% variance to contract, <3% annual increase if renegotiating
Why it matters: Price creep is silent margin destruction. A 5% increase here, a “temporary surcharge” there—suddenly your product costs 15% more than your financial model assumed.
How to track it: Keep a master price list. Compare every invoice. Flag variances immediately.
Metric 4: Responsiveness Score (RS)
What it measures: How quickly and effectively suppliers respond to inquiries and issues.
The formula:
RS = Average Response Time (in hours) + Resolution Time (in days) × 10Lower is better. Under 30 is excellent. Over 100 is a problem.
Target: Response within 24 hours, issue resolution within 5 business days
Why it matters: In DTC, speed matters. When you need to pivot, reorder, or solve a problem, you can’t wait a week for an email reply.
What to measure:
- Initial response time to emails/calls
- Time to provide quotes
- Time to resolve quality issues
- Time to process change orders
Metric 5: Total Cost of Ownership (TCO)
What it measures: The true, complete cost of working with a supplier—not just unit price.
The formula:
TCO = Unit Price + (Shipping ÷ Units) + (Quality Costs ÷ Units) + (Admin Costs ÷ Units) + (Rush Fees ÷ Units)Target: Varies, but TCO should be the number you use for all decisions, not unit price
Why it matters: The cheapest supplier is almost never the cheapest supplier.
I worked with a brand that switched to a supplier with prices 15% lower. Win, right?
Six months later:
- Shipping costs were higher (longer lead time = more air freight)
- Quality issues tripled their returns
- Admin time doubled dealing with communication problems
- They needed rush orders twice at premium rates
Their “15% savings” cost them 22% more when we calculated TCO.
The Finance Connection: True Cost vs. Unit Price
Here’s where most DTC founders get it wrong.
They compare suppliers on unit price. Supplier A is $4.50, Supplier B is $5.00. Supplier A wins.
But unit price is a lie. A convenient, easy-to-compare lie.
True cost includes everything:
Direct costs:
- Unit price
- Shipping and freight
- Duties and tariffs
- Payment terms cost (Net 60 is worth 2-3% over Net 0)
Indirect costs:
- Quality failures (returns, replacements, customer credits)
- Late delivery costs (expedited shipping, lost sales, campaign delays)
- Administrative burden (time spent managing issues)
- Opportunity cost (what you could do with better cash flow)
The calculation your CFO wants to see:
True Landed Cost = Unit Price + Freight per Unit + Duties per Unit + Quality Cost per Unit + Late Delivery Cost per Unit - Payment Term Value per UnitWhen you run this calculation, the “expensive” supplier often becomes the smart choice.
This is why supply chain and finance need to be in the same conversation. Finance sees the P&L impact. Supply chain sees the operational reality. Together, you make decisions that actually work.

Conversation Scripts: Every Scenario Covered
Data is useless if you don’t act on it. Here’s exactly what to say when your scorecard reveals problems.
Script 1: The Underperformer
When a supplier scores yellow or red on multiple metrics:
“I wanted to share some data from our supplier scorecard. Over the past quarter, we’re seeing on-time delivery at 78% against our 95% target, and quality acceptance at 94% against our 98% target.
I value our partnership and want to find a path forward. Can we schedule a call to review what’s driving these numbers and create an improvement plan?”
Why it works: Leads with data, not emotion. Shows you’ve done your homework. Opens dialogue rather than issuing ultimatums.
Script 2: The Price Discussion
When price variance shows creeping costs:
“I’ve been reviewing our cost history, and I’m seeing a 12% increase over the past 18 months that we haven’t formally discussed.
Our volumes have also grown 40% in that time. I’d like to have a conversation about aligning our pricing with our current partnership level. What’s the best time for a call?”
Why it works: Acknowledges the price increase isn’t necessarily wrong—just needs discussion. Frames volume as leverage without being aggressive.
Script 3: The Strategic Review
For your annual supplier evaluation:
“We’re conducting our annual supplier reviews, and I wanted to share your scorecard results. You’re scoring green on quality and responsiveness, which we really appreciate.
We’d like to discuss how we can deepen this partnership—potentially with larger commitments in exchange for improved terms. Interested in exploring?”
Why it works: Recognizes good performance. Positions improvement as mutual benefit. Creates opportunity for negotiation from strength.
Script 4: The Breakup (When Necessary)
When the data says it’s time to move on:
“Thank you for our partnership over the past two years. After reviewing our scorecard data and business needs, we’ve decided to transition to a new supplier for [product category].
We’d like to make this transition smooth. Our last order will be [date], and we’ll need [specific support] during the handoff. I appreciate your professionalism through this process.”
Why it works: Professional, not personal. Clear timeline. Requests cooperation. Leaves the door open for future relationships.
The Red/Yellow/Green Framework
Not all problems are equal. Here’s how to categorize and respond:
🟢 GREEN: Performing (Keep and Reward)
Metrics:
- OTDR: 95%+
- QAR: 98%+
- PV: Within contract
- RS: Under 30
- TCO: Meeting or beating targets
Actions:
- Send appreciation (it matters more than you think)
- Explore partnership deepening
- Consider increased volume commitments
- Negotiate improved terms from position of mutual success
🟡 YELLOW: Watch List (Improve or Prepare)
Metrics:
- OTDR: 85-94%
- QAR: 95-97%
- PV: 1-5% over contract
- RS: 30-60
- TCO: 5-10% above target
Actions:
- Schedule performance review conversation
- Create 90-day improvement plan with specific targets
- Begin identifying backup suppliers (don’t wait)
- Document issues more rigorously
- Increase inspection and monitoring
🔴 RED: Critical (Fix Fast or Exit)
Metrics:
- OTDR: Below 85%
- QAR: Below 95%
- PV: 5%+ over contract
- RS: Above 60
- TCO: 10%+ above target
Actions:
- Immediate escalation conversation
- Written improvement plan with 30-day milestones
- Actively source replacement supplier
- Reduce dependency (split orders if possible)
- Prepare exit timeline
Your Scorecard Template
Here’s the exact template. Copy it. Use it. Share it with your team.
Supplier Scorecard: [Supplier Name]
Review Period: [Quarter/Month]
Reviewer: [Name]
Date: [Date]
METRIC 1: On-Time Delivery Rate
| Total Orders | On-Time Orders | OTDR | Target | Status |
|---|---|---|---|---|
| [#] | [#] | [%] | 95% | 🟢🟡🔴 |
METRIC 2: Quality Acceptance Rate
| Units Received | Units Accepted | QAR | Target | Status |
|---|---|---|---|---|
| [#] | [#] | [%] | 98% | 🟢🟡🔴 |
METRIC 3: Price Variance
| Contracted Price | Actual Avg Price | Variance | Target | Status |
|---|---|---|---|---|
| [$] | [$] | [%] | 0% | 🟢🟡🔴 |
METRIC 4: Responsiveness Score
| Avg Response (hrs) | Avg Resolution (days) | Score | Target | Status |
|---|---|---|---|---|
| [#] | [#] | [#] | <30 | 🟢🟡🔴 |
METRIC 5: Total Cost of Ownership
| Target TCO | Actual TCO | Variance | Status |
|---|---|---|---|
| [$] | [$] | [%] | 🟢🟡🔴 |
Overall Status: 🟢🟡🔴
Key Observations:
- [Observation]
- [Observation]
- [Observation]
Action Items:
- [Action + Owner + Due Date]
- [Action + Owner + Due Date]
Next Review Date: [Date]
The Complete Supplier Power Month System
Let’s recap what you’ve built this month:
Week 1: Know Your Power
- Identified your leverage points
- Understood supplier dependencies
- Mapped your negotiating position
Week 2: Negotiate Like a Pro
- Learned the frameworks that get results
- Practiced the scripts
- Built confidence in difficult conversations
Week 3: Document Everything
- Created systems to capture agreements
- Built templates for contracts and communications
- Protected yourself from “I never said that”
Week 4: Track Performance
- Built your Supplier Scorecard
- Defined the 5 metrics that matter
- Created decision frameworks for action
Together, this is a complete system for managing suppliers proactively instead of reactively.
Know → Negotiate → Document → Track
Four steps. One flywheel. Complete supplier power.
🛠 Your Action Items: Do This by End of Week
Don’t just read this. Do it.
Action 1: Pick your top 3 suppliers by spend
These are the relationships that matter most. Start here.
Action 2: Calculate OTDR and QAR for the past quarter
Even rough numbers beat no numbers. Pull your data.
Action 3: Build your first scorecard
Use the template above. Fill it in. See what the data says.
Action 4: Schedule one conversation
Based on your scorecard, identify one supplier conversation you need to have. Put it on the calendar.
Action 5: Set your review cadence
Monthly for critical suppliers. Quarterly for everyone else. Put recurring reviews in your calendar now.
This isn’t about more work. It’s about finally making your vendor management count.
When you know your numbers, you negotiate from strength. When you track performance, you catch problems early. When you have systems, you sleep better.
Stop managing suppliers by feeling. Start managing them with data.
📦 Free Resource: Download the complete Supplier Scorecard template
🎧 Listen next: Supplier Power Month Episode 4 – Building Your Tracking System
Until next time,
— Lara