
Most DTC founders have never calculated their CCC. Here’s what it is, how to find yours, and why it explains everything about your cash flow.
Here is a number most DTC founders have never calculated: their Cash Conversion Cycle.
It answers one simple question: How long from the moment you pay your supplier to the moment a customer’s payment hits your account?
For most DTC brands, that number is 60 to 120 days. You pay for inventory today. That cash doesn’t come back for 2 to 4 months. And in the meantime, rent is due. Payroll is due. Ads are due.
If you’ve ever felt like your business is growing but your bank account isn’t keeping up, this is almost certainly why. Not a revenue problem. Not a margin problem. A timing problem. And until you can see it in numbers, you can’t fix it.
This is one of the first things we calculate when we start working with a DTC brand at Move. It usually explains about 80% of their cash stress in a single number.
What Is Cash Conversion Cycle?
Cash Conversion Cycle (CCC) measures the time it takes for your business to convert inventory investments into cash from sales. Think of it as the roundtrip your money takes: out the door to your supplier, through your warehouse, into a customer’s hands, and back into your bank account.
The shorter that trip, the healthier your cash flow. The longer it takes, the more working capital you need just to stay operational.
CCC = DIO + DRO − DPO
- (DIO) Days Inventory Outstanding. How long does inventory sit before it sells? Calculated as (Average Inventory ÷ COGS) × 365. This is usually the biggest number in the equation and the one you have the most control over.
- (DRO) Days Receivables Outstanding. How long before customer payments clear? For DTC credit card sales, this is typically 1 to 5 days. For wholesale accounts, it can stretch to 30 to 60 days.
- (DPO) Days Payables Outstanding. How long before you pay your suppliers? This one works in your favor. Longer payment terms mean more float, which means your cash stays in your account longer.
The key insight here: DIO and DRO add days to your cycle (bad for cash flow), while DPO subtracts days (good for cash flow). Most DTC founders spend all their energy trying to increase revenue when they could dramatically improve cash flow just by adjusting these three levers.
A Real Example
Let’s make this concrete. Say you’re running a DTC skincare brand. Here’s what a typical CCC calculation looks like:
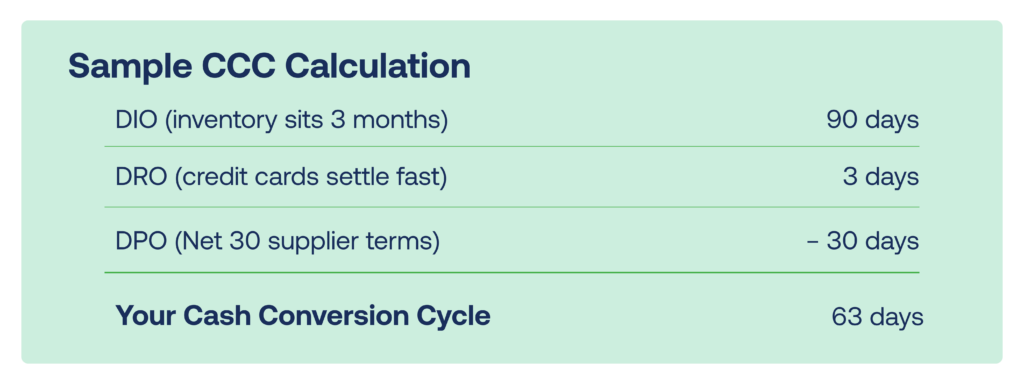
That means every dollar you spend on inventory takes 63 days to come back to you. If you’re spending $30K per month on inventory, you need roughly $63K in working capital just sitting in the pipeline at all times. Not for growth. Not for marketing. Just to keep the machine running.
Now imagine what happens when that number is 90 days. Or 107. Your working capital requirement doesn’t grow linearly. It compounds with your revenue. The faster you grow, the more cash you need locked up in the cycle.
The $3M Brand That Was Always Broke
I worked with a $3M brand growing 40% year over year. Profitable on paper. Great product-market fit. Customers loved them. And the founder was constantly scrambling for cash.
She’d done everything right by the traditional playbook: reinvesting in product, building a team, scaling ad spend. But every month felt like a sprint to make payroll. She assumed she just needed more revenue to fix it.
When we sat down and calculated her CCC, the answer was immediate.
Her numbers: DIO of 95 days + DRO of 27 days (she had a wholesale channel with slow-paying retailers) − DPO of just 15 days (she was paying suppliers early to “maintain the relationship”). CCC: 107 days.
On $3M in revenue, a 107-day cash conversion cycle meant she needed roughly $900K in working capital just to operate. Not to grow. Just to keep the lights on.
That’s not a revenue problem. That’s a timing problem. And it’s the kind of problem that doesn’t show up on your P&L. It hides in the gap between your profit and your bank account.
We started by addressing the three easiest levers. We renegotiated her supplier terms from Net 15 to Net 45, adding 30 days of float. We required 50% deposits from her wholesale accounts, cutting her DRO from 27 days to 11. And we restructured her inventory planning to reduce DIO from 95 days to 62.
Her new CCC: 28 days. Same revenue. Same margins. Completely different business.
Where the Extra Days Hide
If your CCC is higher than you’d like, the extra days are usually hiding in predictable places. Here are the five most common ones I see when auditing DTC brands:
- Too much safety stock. You’re holding 4 to 6 months of inventory “just in case.” Every extra month of stock adds 30 days to your DIO. If your demand forecast says you need 8 weeks of stock and you’re holding 20, that’s 12 weeks of trapped cash.
- Slow-moving SKUs dragging up your average. Your hero products might turn in 45 days, but those bottom-performing SKUs sitting for 90+ days pull your overall DIO up dramatically. This is where SKU rationalization directly improves cash flow.
- Weak payment terms with suppliers. Paying on Net 15 when you could negotiate Net 30 or Net 45 is leaving free float on the table. Every extra day of DPO is a day your cash stays in your account instead of your supplier’s.
- Wholesale accounts without deposit requirements. If you’re shipping $20K of product to a retailer and waiting 45 to 60 days for payment, you’re essentially financing their inventory with your cash. Require deposits upfront or shorten your terms.
- Ordering too early. Goods arrive weeks before you need them and sit in storage burning through warehousing fees. Tighter ordering windows, aligned with your actual sell-through velocity, can shave 15 to 30 days off your DIO without any risk of stockouts.
Benchmarks by Business Model
Your target CCC depends on your channel mix. Here’s what healthy looks like based on the hundreds of brands we’ve worked with:
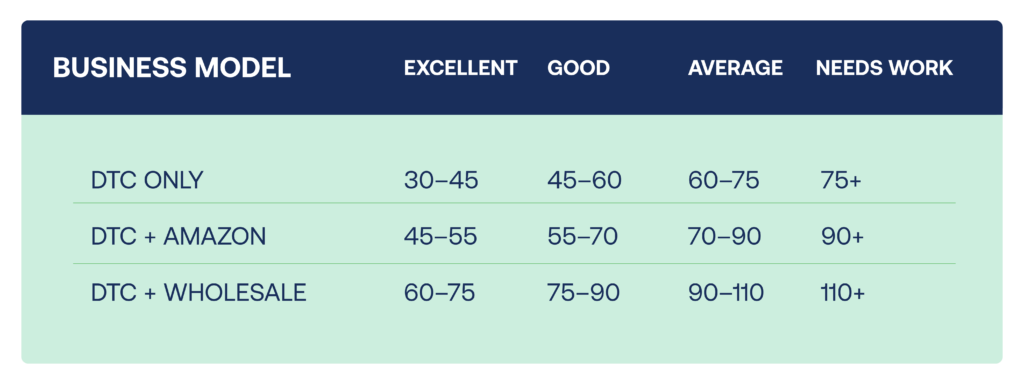
Notice the pattern: more channels means more cash timing complexity. Every channel you add introduces a different DRO, different inventory requirements, and different payment schedules. That’s not a reason to avoid multichannel. It’s a reason to plan for it with your eyes wide open.
How to Calculate Your CCC (15 Minutes)
This takes less time than your morning coffee run. Here’s the step-by-step:
- Calculate your DIO. Pull your average inventory value and your COGS from the last 12 months. Divide average inventory by COGS, then multiply by 365. (Average Inventory ÷ COGS) × 365 = DIO
- Determine your DRO. For pure DTC with credit card payments, this is typically 3 to 5 days. If you have wholesale or marketplace channels, calculate your actual average collection time from invoicing to payment received. DTC: 3–5 days | Wholesale: Check your AR aging
- Confirm your DPO. This is your average supplier payment terms. If you’re on Net 30 with most suppliers, your DPO is around 30. If you’re paying early (and many founders do without realizing it), your actual DPO could be much lower. Your actual payment terms = DPO
- Run the formula. Add DIO and DRO, then subtract DPO. That’s your Cash Conversion Cycle. Write it down. Look at it. Now you know exactly how long your cash is trapped. CCC = DIO + DRO − DPO
Pro tip: Run this calculation for the last 4 quarters individually. If your CCC is getting longer over time, your cash problem is accelerating, even if revenue is growing. That’s the warning sign most founders miss until it becomes a crisis.
The Bottom Line
Your Cash Conversion Cycle explains why you feel tight on cash even when you’re growing. It’s the invisible gap between earning revenue and having money to spend. And once you can see it, you can start closing it.
Every day you shave off your CCC frees up working capital. A brand doing $2M in annual revenue that reduces their CCC by just 15 days frees up roughly $82K in cash. Not new revenue. Not a loan. Cash that was already yours, just trapped in the cycle.
Know your number. That’s the first step. Next week, we’re covering the reorder timing system that keeps your DIO in check without risking stockouts. And in Week 4, we’ll walk through how one brand freed $120K in trapped cash using the exact framework we’ve been building all month.
Your cash isn’t missing. It’s on a very slow road trip. Let’s shorten the route.
Until next time,
— Lara
Want to Go Deeper?
Watch Lara walk through a real CCC calculation on YouTube, complete with a live spreadsheet breakdown and the exact negotiation scripts we used to cut one brand’s cycle from 107 days to 28.
Already know your bottleneck?
Join the Supply Chain Lounge on Slack where we discuss these exact challenges every week.