Most DTC founders track gross margin and miss that their “profitable” products are bleeding money. Learn why CM is the number that pays your bills.
“We have 65% gross margin.”
I hear this constantly. Founders proudly quoting GM like it’s the number that determines success. They see it on their P&L. Their accountant mentions it. Their investors ask about it.
Here’s the uncomfortable truth: Gross margin is for investors. Contribution margin pays your bills.
The gap between them is where DTC brands die.
I’ve watched this movie too many times. Founders scaling products they think are profitable, only to run out of cash while “crushing it.” Not because they failed. Because they were measuring the wrong thing.
Let me show you what I mean.
The Difference That Changes Everything
Let’s get the definitions out of the way.
Gross Margin
Revenue minus Cost of Goods Sold (COGS), divided by Revenue. That’s it. Just your product cost subtracted from what you sold it for.
Contribution Margin
Revenue minus ALL variable costs, divided by Revenue. This includes everything that actually happens when you sell a product.
For investors and accountants, gross margin matters. It tells them about your pricing power and manufacturing efficiency. It looks great on pitch decks.
Contribution margin includes:
- COGS (yes, that’s still in there)
- Pick, pack, and fulfillment costs
- Shipping and delivery
- Payment processing fees
- Platform fees
- Customer acquisition cost (if you’re being honest with yourself)
Gross Margin
– Theoretical
– What you could make
Contribution Margin
– Practical
– What you actually take home
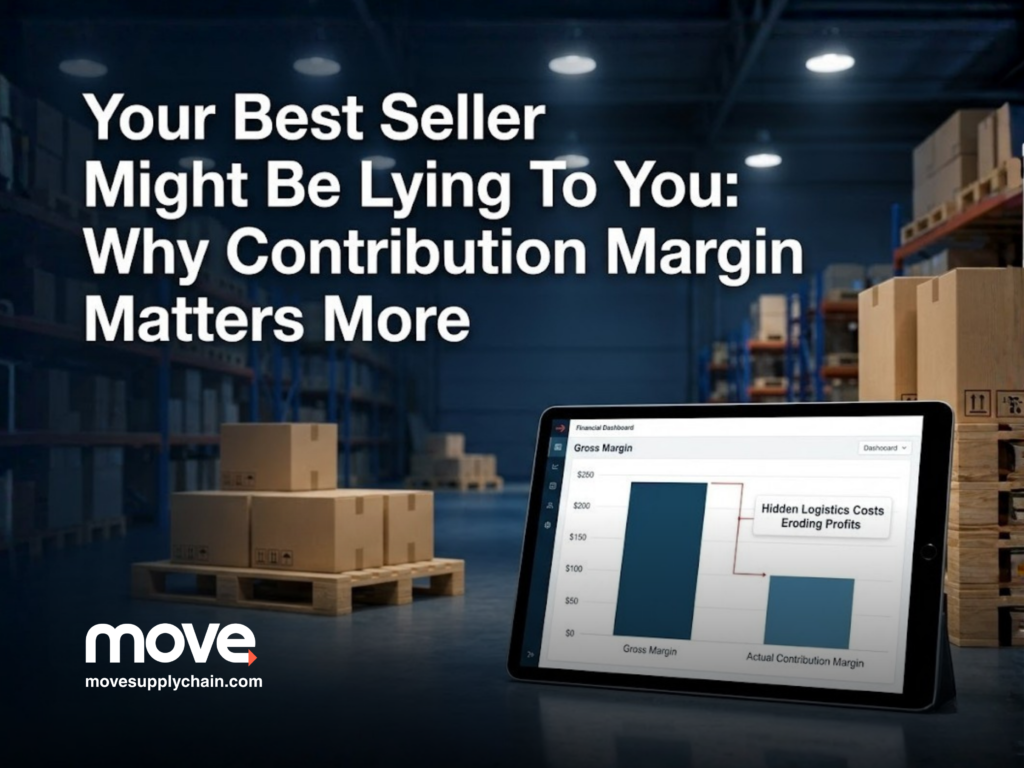
The Math That Matters
Let me show you what this looks like on a real product.
Say you sell a $50 item. Your COGS is $15.
Gross Margin: ($50 – $15) / $50 = 70%
Beautiful. You’d tell your investors about this. You’d feel good scaling this product.
Now let’s add reality.
| Cost Component | Amount |
|---|---|
| COGS | $15.00 |
| Pick & Pack | $3.50 |
| Shipping | $8.00 |
| Payment Processing (3%) | $1.50 |
| Platform Fee (2%) | $1.00 |
| Customer Acquisition | $12.75 |
| Total Variable Costs | $41.75 |
Contribution Margin: ($50 – $41.75) / $50 = 16.5%
What you think
– 70%
– $35 per unit for growth
What you keep
– 16.5%
– $8.25 per unit. That’s it.
That’s not a rounding error. That’s the difference between a scaling machine and a treadmill.
And here’s the kicker: if your CAC goes up by even $3 during a competitive Q4, your CM drops to 10.5%. Now you’re making $5.25 per unit. On a $50 product.
Scale that, and you scale yourself into bankruptcy.
Why Your Best Seller Might Be Your Worst Product
This is the part that keeps me up at night for the founders I work with.
The Hero SKU Trap
A $4M/year brand with a hidden problem
I once worked with a brand doing $4M a year. Beautiful product photos. Great reviews. Marketing team convinced they had a “hero SKU” that drove 40% of revenue.
Everyone loved this product. It was the face of the brand.
“Hero” SKU
11%
Contribution Margin
Keeps $1,100 per $10K revenue
“Boring” Bundle
32%
Contribution Margin
Keeps $3,200 per $10K revenue
They’d been pouring ad spend into the hero SKU for two years. Scaling it aggressively. Celebrating every sales spike.
They were celebrating their way to cash problems.
Not because the hero product was bad. The gross margin was fine. The marketing was working. Customers loved it. But when you stacked the shipping (it was heavy), the higher CAC (competitive category), and the frequent promotions they ran on it, the numbers told a different story.
The product that looked like their biggest asset was their biggest liability.

The Movie I’ve Watched Too Many Times
Here’s the pattern I’ve seen destroy brands:
Year 1
Founder launches. Product-market fit. Gross margins look great. “We’re a 65% margin business!”
Year 2
Revenue grows. $500K becomes $1M. Founder scales what’s working—more ads, more inventory, more of the hero SKU.
Early Year 3
Revenue hits $2M. The founder is exhausted but excited. They’re “crushing it.”
Late Year 3
Cash gets tight. Founder doesn’t understand why. Revenue is up. Margins (gross margins) look the same. What’s happening?
What’s happening is contribution margin erosion.
CAC crept up 15% because the category got more competitive. Shipping rates increased. They had to expedite a few shipments. They ran more promotions to hit revenue targets.
Each decision was small. Each one was “necessary.”
Combined, they turned a 20% CM business into an 8% CM business—while gross margin stayed exactly the same.
The founder was watching the wrong number the whole time.
Revenue doubled. Profit disappeared. Cash died.
The scariest part? The P&L still looked “fine” to anyone just watching gross margin.
The Flywheel Connection
Here’s why contribution margin isn’t just a finance metric. It’s the number that connects your entire business.
The MOVE DTC Flywheel™
Marketing
They can’t optimize for profitable growth if they don’t know what “profitable” actually means per SKU. ROAS goals mean nothing without CM. A 5x ROAS on a 10% CM product is worse than a 3x ROAS on a 35% CM product.
Supply Chain
When negotiating with vendors or deciding whether to air freight, CM is my compass. “Save $2 per unit” means nothing until I know what percentage of margin that represents.
Finance
Cash flow forecasting built on gross margin is fiction. You can’t project whether you’ll make payroll based on a number that ignores half your costs.
Marketing creates demand → Supply Chain fulfills it → Finance fuels it.
The metric that ties them together? Contribution margin.
When all three departments use the same metric—contribution margin by SKU—decisions actually align. Marketing scales the right products. Supply Chain optimizes the costs that actually move the needle. Finance models reality instead of theory.
Without it, you have three teams optimizing three different things, wondering why the business isn’t working.
What to Do About It
I’m not going to tell you to overhaul your entire reporting system this week. That’s overwhelming and you’ll put this article in the “interesting but I’ll do it later” folder.
Instead, do ONE thing.
Your Action Item
This week, calculate contribution margin for your top 5 SKUs.
That’s it. Five products. Here’s the formula:
CM = (Revenue – COGS – Fulfillment – Shipping – Payment Fees – CAC) / Revenue
Use your actual numbers. Not averages. Not estimates. Pull the real data.
You can do this in a spreadsheet in 2-3 hours. Use your shipping invoices, your platform fees, your ad spend by product.
When you see the numbers, you’ll know exactly what to do next.
Maybe you’ll discover your hero SKU is actually profitable and everything is fine. Great. Now you have confidence instead of hope.
More likely, you’ll find at least one SKU that’s lying to you. One product you’ve been scaling that’s actually costing you money every time it sells.
That’s not failure. That’s clarity.
And clarity is the first step to building a business that actually compounds.
Am I scaling my most profitable products, or my most popular ones?
If you’ve never done this exercise, I promise you—something will shift in how you see your business.
Until next time,
— Lara
Want to Go Deeper?
Watch my full breakdown on calculating contribution margin by SKU.
Already know your bottleneck?
Join the Supply Chain Lounge on Slack where we discuss these exact challenges every week.